- What data should be excluded?
- Q.REC indicators
- Data transformation
- Q.REC Indicators
- Analysing and presenting the data
- Q.REC Flowchart
- USP characteristics
- Optical service characteristics
- Primary analysis of spectacle quality – Q.REC Indicator(s)
- Association between spectacle quality and USP and/or optical service characteristics
- Association between written prescriptions and optical service characteristics
- Association between dispensed spectacles and written prescriptions
- Unnecessary prescribing with emmetropes
- Relevant documents
After data are cleaned, analysis is recommended to be conducted by either a biostatistician or a researcher with statistical analysis experience.
What data should be excluded?
If more than 3 baseline refractions were conducted on a USP, exclude the refraction(s) that are the most different to the others.
If USPs were identified by certain optical services, the number and percentage of visits should be reported, however their data should be removed from all other analysis.
Q.REC indicators
The Q.REC indicator(s) are used to compare the dispensed spectacles from optical services to the USP’s baseline prescription.
Q.REC indicator 1: Optimally prescribed spectacles
Q.REC Indicator 1 is the key primary outcome for this study. It has been demonstrated that when glasses pass this indicator that USPs have significantly better vision and comfort compared to glasses that do not pass this indicator. This shows us the quality of refractive error care and information to plan and monitor optical services.
Table 1 Q.REC Indicator 1 criteria
|
Spectacle component |
Tolerance limits compared to baseline prescription |
|---|---|
|
Spherical power |
± 0.50 dioptre |
|
Cylindrical power |
± 0.50 dioptre |
|
Cylindrical axis (if baseline |cylindrical power| ≤ 0.50 DC) |
± 7 degrees |
|
Cylindrical axis (if baseline |cylindrical power| > 0.50 DC – ≤ 1.50 DC) |
± 5 degrees |
|
Cylindrical axis (if baseline |cylindrical power| > 1.50 DC) |
± 2 degrees |
|
Horizontal prism (total) |
< 1 prism dioptre (in/out direction) |
|
Vertical prism (total) |
< 0.50 prism dioptre (up/down direction) |
Q.REC indicator 2: Adequately prescribed spectacles
For settings where sphero-cylindrical lenses are rarely prescribed or available, Q.REC indicator 2 can be used as the primary outcome that shows the quality of refractive error care. Similarly, it can help with planning and monitoring optical services, however is not as accurate as Q.REC indicator 1. For projects that use Q.REC indicator 1 as the primary outcome, Q.REC indicator 2 can be a secondary outcome or not used at all.
Table 2 Q.REC Indicator 2 criteria
|
Spectacle component |
Tolerance limits compared to the baseline prescription |
|---|---|
|
Spherical equivalent power |
± 0.50 dioptre |
|
Horizontal prism (total) |
< 1 prism dioptre (in/out direction) |
|
Vertical prism (total) |
< 0.50 prism dioptre (up/down direction) |
Data transformation
Baseline refractions
For each eye, all components of the refraction should be averaged, this includes the distance spherical power, near spherical power (particularly if the USP has a near addition with their prescription) cylindrical power, cylindrical axes, distance and near pupillary distances, and distance and near visual acuities.
Categorising into refractive error types
Each USP can be grouped into at least one refractive error type based on the baseline refraction. The following definitions for each type are recommended:
- Myopia: spherical equivalent < -0.50 DS in at least one eye
- Hyperopia: spherical equivalent > +0.50 DS in at least one eye
- Astigmatism: > 0.50 DC in at least one eye
- Emmetropia: spherical equivalent ≥ -0.50 DS and ≤ +0.50 DS in both eyes
- Presbyopia (objective definition): ≥ 1.00 D added to the best optical distance correction
Note: To calculate spherical equivalent, the following formula can be used: Spherical equivalent power = Spherical power + (Cylindrical power)/2
Visual acuities
Distance and near visual acuity for the right, left and both eyes should be converted into logMAR decimal format. As each USP is likely to have unique near working/viewing distances, near visual acuity should be recalculated to account for their working distance.
Categorical variables of ‘good vision’ can be created for the right and left eyes separately and with both eyes open. USP while wearing dispensed spectacles is considered to achieve ‘good vision’ if the corrected visual acuity is <1.5 lines worse than baseline best-corrected visual acuity at distance or near.
Suitability of spectacle lens types
A USP is considered suitable for a spectacle lens type (either single vision distance / single vision near / bifocal / multifocal) if at least one of the study optometrists ticks that they are suitable for that lens type.
Q.REC Indicators
Q.REC Indicator 1: Optimally prescribed spectacles
To compare the dispensed spectacles to the baseline refraction on whether the spectacles pass Q.REC Indicator 1, data are required to be transformed and calculated.
|
Component / Indicator |
Analysis for Q.REC Indicator 1: Optimally prescribed spectacles |
|---|---|
|
Spherical power |
For each eye:
|
|
Cylindrical power |
For each eye:
|
|
Cylindrical axis |
For each eye:
|
|
Horizontal prism |
For each eye:
|
|
Vertical prism |
To determine the direction of vertical prism:
|
|
QREC Indicator 1 |
Spectacles are optimal if:
|
To compare the written prescription to the baseline refraction on whether the spectacles pass Q.REC Indicator 1, at a minimum, the steps of spherical power, cylindrical power and cylindrical axis components in the above table are applied. The horizontal prism component can be considered for inclusion if pupil distance(s) are provided in the written prescription.
Q.REC Indicator 2: Adequately prescribed spectacles
To compare the dispensed spectacles to the baseline refraction on whether the spectacles pass Q.REC Indicator 2, data will require transformation as shown in the table below.
|
Component / Indicator |
Steps |
|---|---|
|
Spherical equivalent power |
For each eye:
|
|
Horizontal prism |
Refer to table: Analysis for Q.REC Indicator 1: Optimally prescribed spectacles |
|
Vertical prism |
Refer to table: Analysis for Q.REC Indicator 1: Optimally prescribed spectacles |
|
QREC Indicator 2 |
Spectacles are adequate if:
|
To compare the written prescription to the baseline refraction on whether the spectacles pass Q.REC Indicator 2, the steps of spherical equivalent power component in the above table are applied. The horizontal prism component can be considered for inclusion if pupil distance(s) are provided in the written prescription.
Analysing and presenting the data
The following section is a recommendation of data that can be analysed and presented. This initial analysis might produce emerging outcomes that are of interest to your context and warrant further analysis.
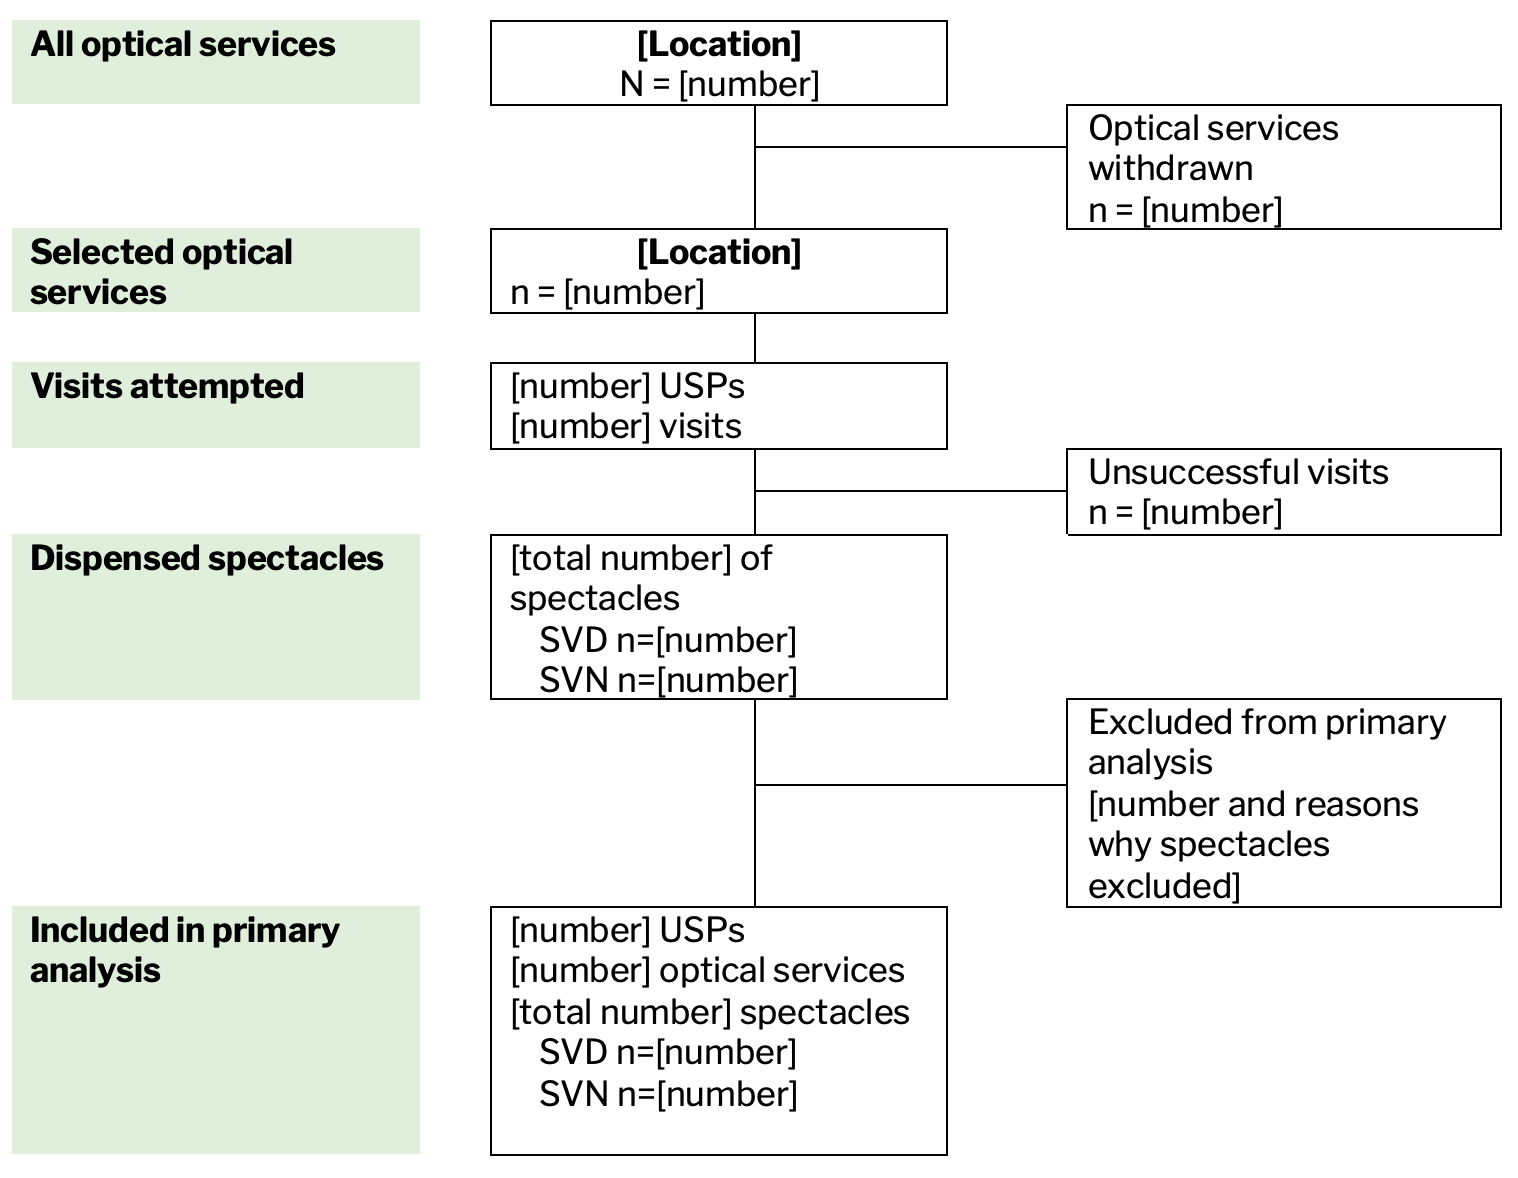
Q.REC Flowchart
A flowchart of the optical services sampling frame, the ones excluded, recruited, USPs recruited, services visited and the number of spectacles dispensed are the minimum details to be included.
USP characteristics
Describing USP characteristics can be presented in a table. Examples of descriptors include:
- Age – mean and standard deviation or categorised into groups
- Gender
- Refractive error type
- Presence of presbyopia
- Pupil distances – mean and standard deviation
- Types of spectacle lenses the USPs are suitable for
The table can be presented as the total group or disaggregated. If USPs are disaggregated, Fisher’s exact tests or Chi-square tests for categorical variables or ANOVA for continuous variables can be used to test USP differences by their disaggregated groups.
Optical service characteristics
Describing optical service characteristics, such as who provided care and testing procedures used, can be presented in a table. Examples of descriptors include:
- Gender of clinician who conducted refraction
- Whether certification of refraction or health department registration observed
- Focimetry conducted
- Components of distance refraction
- Components of near refraction
- Pupil measurement conducted
- Clarity of communication
Primary analysis of spectacle quality – Q.REC Indicator(s)
The main outcome of the Q.REC study is the proportion of spectacles that are optimal and/or adequate in quality (i.e. pass Q.REC Indicator 1 and/or Q.REC Indicator 2) including a 95% confidence interval. This can be disaggregated by location, or spectacle type (if there is a hypothesis that there might be a quality difference in the way distance and near spectacles are dispensed). Sampling weights should also be considered if any particular sub-groups are much larger than others, and the number of spectacles dispensed for each sub-group differ. The confidence intervals should be estimated by using robust standard errors to account for intra-service correlation.
Q.REC Indicator 1 or 2 can also be presented on the proportion of glasses that pass each indicator component, and the patterns of whether each component are met or not.
The written prescription outcome would be the proportion of written prescriptions that are optimal or adequate in quality. The proportion and 95% confidence interval can be disaggregated, and also compared to the main spectacle outcomes above. The confidence intervals should be estimated by using robust standard errors to account for intra-service correlation.
Association between spectacle quality and USP and/or optical service characteristics
The association between spectacle quality and USP and/or optical service characteristics can be assessed via univariable logistic regression. Multivariable regression models can also be considered. Robust standard errors should also be used within all logistic regression models to account for intra-service correlation. Results can be presented with odds ratios, 95% confidence intervals and p-values.
Association between written prescriptions and optical service characteristics
Similarly, the association between written prescriptions and USP and/or optical service characteristics can be assessed via univariable logistic regression. Multivariable regression models can also be considered. Robust standard errors should also be used within all logistic regression models to account for intra-service correlation. Results can be presented with odds ratios, 95% confidence intervals and p-values.
Association between dispensed spectacles and written prescriptions
Data enables you to assess whether the written prescriptions provided to the USP match the dispensed spectacles.
Unnecessary prescribing with emmetropes
If emmetropes are recruited to be USPs in the Q.REC study, the proportion of visits where emmetropes were recommended spectacles can be described. The association between emmetropes being recommended spectacles and optical service characteristics can also be assessed with logistic regression. Results can be presented with odds ratios, 95% confidence intervals and p-values.